
The gap wasn’t closing: an analysis of the poverty-related attainment gap, pre-pandemic to now
A look at the Scottish attainment gap before the 2024 results.

An analysis of qualifications attainment data.
Ahead of the publication of exam results in a couple of week, I have conducted an analysis on the ‘attainment gap’ in Scottish education.
This post is to openly present my findings and the data behind them (a link to the data and notes about the data is accessible in the final section of this post).
Context of the analysis
The poverty-related attainment gap is the difference in educational performance and outcomes between the least and most deprived (richest and poorest) young people in Scotland.
The Scottish Government committed in 2016 that ‘our mission is to make significant progress in closing the gap within the next parliament [by 2021] and to substantially eliminate it within a decade [by 2026]’.
Closing the gap is complex, and important. It is not about statistics, or politics, but life chances.
My interest in doing this analysis was with regards to:
Interrogating the claim that it was the pandemic which has caused the attainment gap to be so wide, and that COVID disruption ruined progress towards closing it.
On results day 2023, the Cabinet Secretary for Education said ‘We are absolutely working towards closing that gap by 2026. However, I think it is important to remember when that target was set nobody predicted that COVID was going to occur, the Cost-of-Living crisis, all of these external factors were not there in the same way’.
And the previous Cabinet Secretary said in January 2023 ‘pre-pandemic, the poverty-related attainment gap was closing, but the negative impact of the pandemic cannot be ignored’.
Interrogating statements on exam results day that progress has been made because the attainment gap is lower in 2023 than in 2019.
The following analysis looks at the Higher Attainment Gap and The National 5 Attainment Gap.
The findings are presented, then there is some commentary. Finally, notes on the data I have used can be accessed.
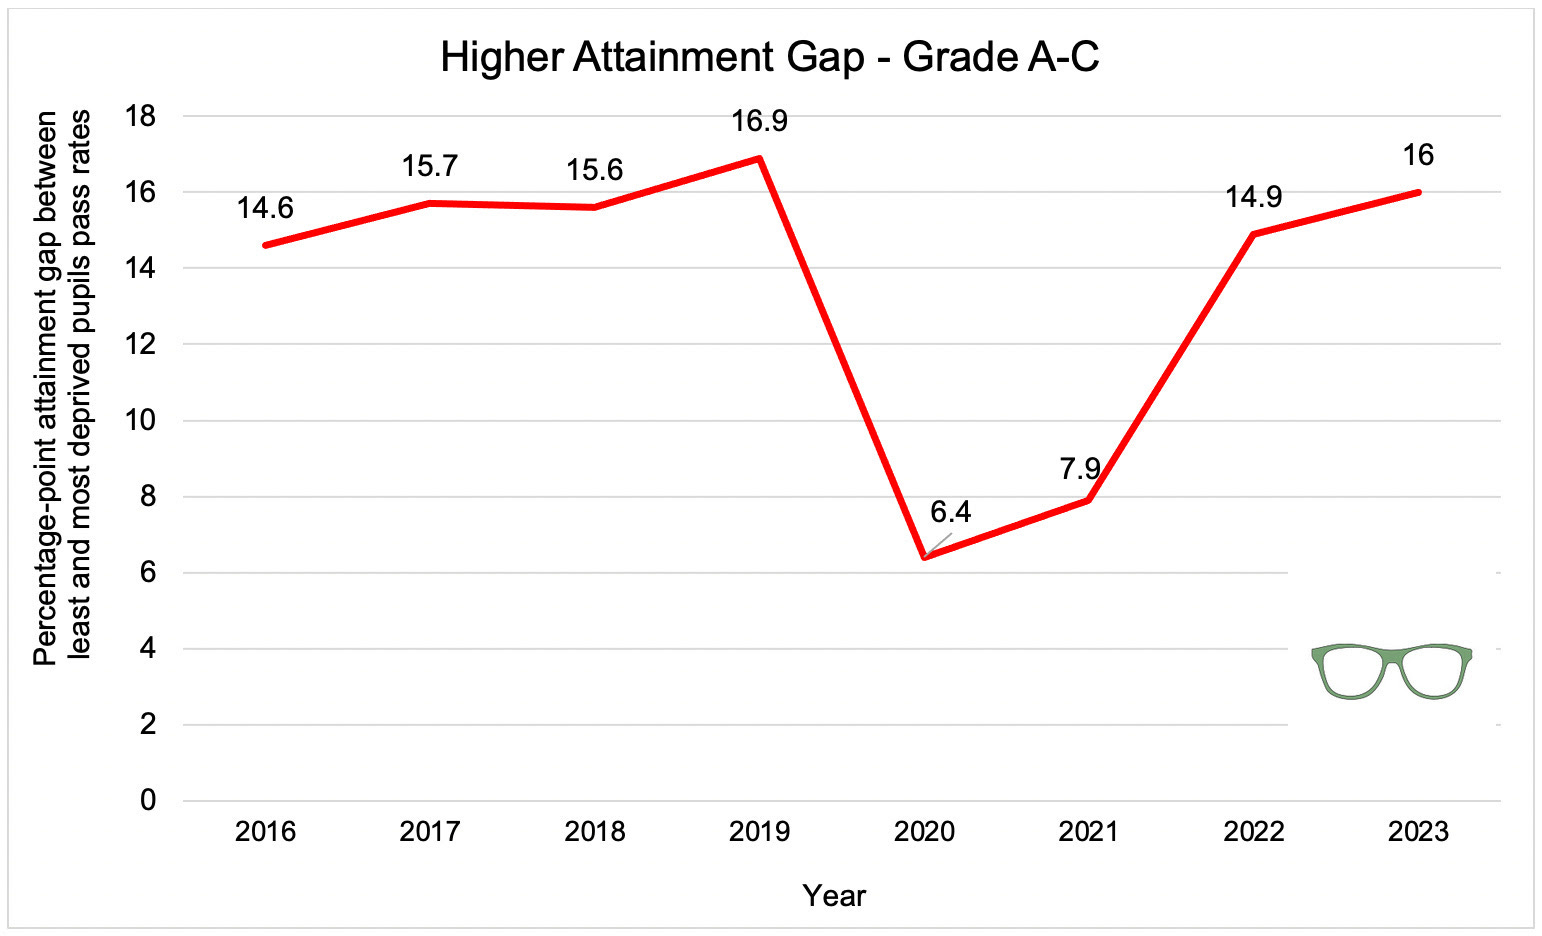
Higher Attainment Gap
The attainment gap at Higher level (the percentage-point pass rate at Grades A-C between pupils from the 20% most and least deprived postcodes) is 16 percentage-points in 2023.
This is up from 14.9% in 2022. It is lower than 16.9 in 2019 (the last pre-pandemic year). However, 2019 saw the highest gap since new Higher qualifications were introduced.
The gap increased each year from 2016-2019. The gap is larger now than in 2016, 2017 or 2018. Though it shows broad consistency rather than dramatic increases over this time.
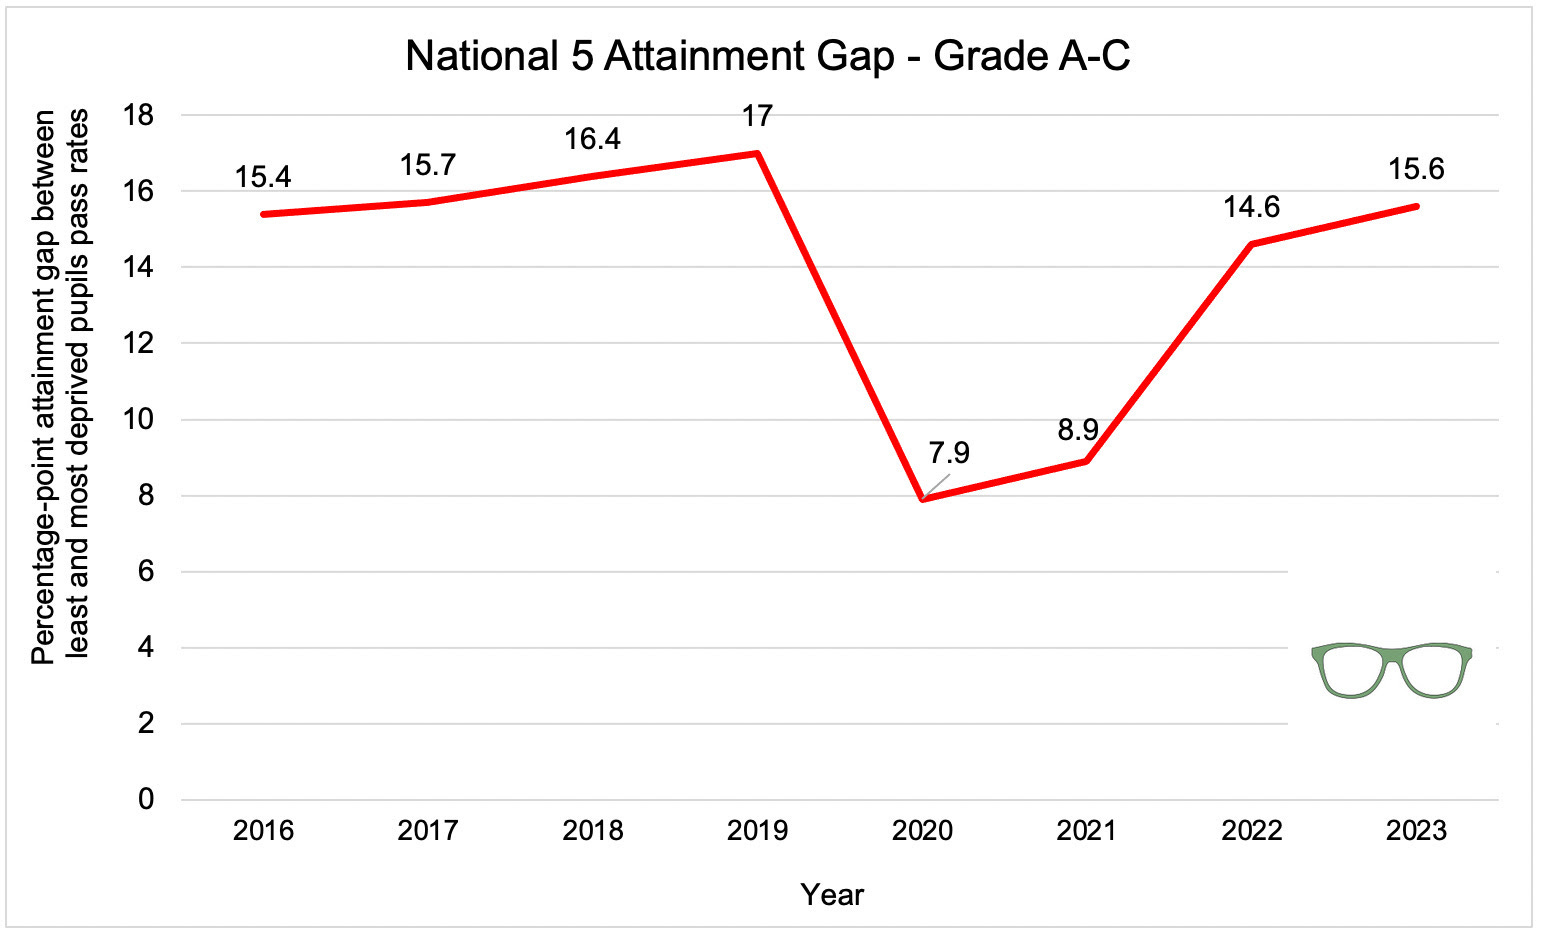
National 5 Attainment Gap
The attainment gap at National 5 level (the percentage-point pass rate at Grades A-C between pupils from the 20% most and least deprived postcodes) is 15.6 percentage-points in 2023.
This is up from 14.6% in 2022.
National 5 results also saw the gap increase each year from 2016-2019.
The gap in 2023 is lower than 2017, 2018 and 2019 but sits in line with those figures.
Discussion
The claim that the poverty-related attainment gap is narrower now than ‘pre-pandemic’ cannot be backed up by the evidence - if trends are considered and not just the selective use of 2019.
In fact, the attainment gap increased each year from 2016-2019 for Highers and National 5. The Higher gap was actually at its highest levels since the full introduction of the new Higher qualifications.
Really, year-on-year variations are not the most important thing. Trends are. What can be seen in the data is a stagnant – and significant - attainment gap between the richest and poorest pupils, which has seen no significant closure.
It is also false to say that there was progress towards closing it before the pandemic, and that the pandemic set that back. Particularly if the commitments towards 2021, and 2026, are considered. The evidence clearly shows that is not the case, and the claim should stop being made.
This is not about cheap points, statistics or anything else, but about life chances and policy delivery.
It is my contention that if we are to have a serious debate on the attainment gap, why it exists (poverty mainly!), and what we can do to close it, we need to be honest about where we are - and why we are where we are.
The data
Note on Higher and National 5 Data
1. 2016 was chosen as the benchmark year for several reasons. It is the year the commitment to close the attainment gap was made, it was the first full year of the Scottish Attainment Challenge funding, and importantly it was the first year the new Highers were exclusively used. Further to this, in 2016, the SIMD map – the measure of inequality we use (the relative deprivation in a postcode) - was also updated. For clarity, it was updated again in 2020.
2. As the excel sheet points out, the data has come from three different SQA sources. This means there are rounding differences in some of the numbers. For each year, the most recent publication where data was accessible was used.
3. In 2020 and 2021, there were no exams. In 2022 and 2023 there were adjustments to courses and assessment. All related to COVID disruption.